Bitcoin doesn’t bounce back. It slouches back
What the math of telephone exchanges and queues tells you about Bitcoin.

Matt Levine has an intuitive model in Money Stuff. Bitcoin, he correctly keeps observing, has no cash flows. There’s nothing to discount, no earnings to capitalize, no rent to collect. The price is just… whatever people are willing to pay for it: it’s monetized attention. I personally find this hilarious and the joke seemingly writes itself roughly once a week with a different setup.
I’ve been reading Money Stuff for years, and at some point the joke stopped feeling like a joke and started feeling like a research design. Because here is the thing about “no cash flows”: if there really are no cash flows, then you cannot model Bitcoin’s price by capitalizing future cash flows. So either the price is unmodelable, or you have to model it using something else entirely. And the something else, when you sit down and think about what’s actually generating prices in a continuous limit-order market, is: arrivals and exits. Buyers showing up. Sellers showing up. Pressure accumulating. Pressure dissipating.
That is a queueing problem.
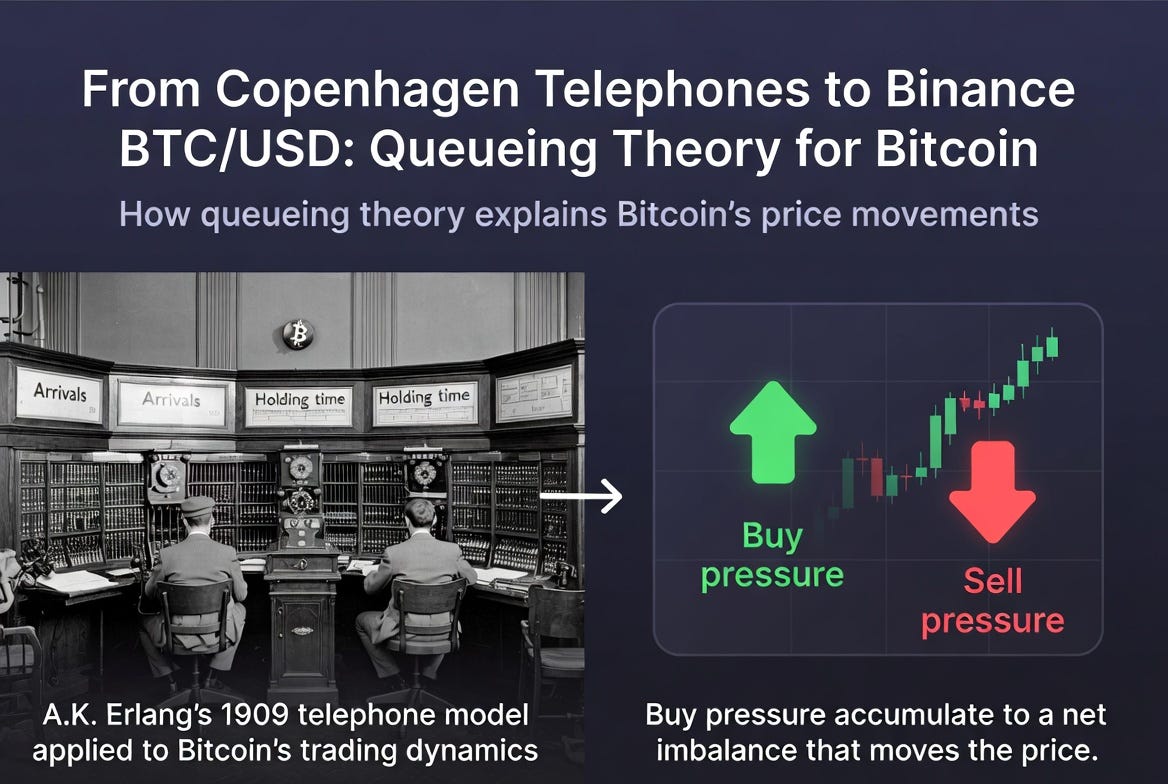
Which is convenient, because a Danish telephone engineer named A.K. Erlang worked out the math in 1909.
Erlang was trying to figure out how many telephone lines the Copenhagen telephone exchange needed. Calls arrive at random times. Each call lasts for some random duration. How many simultaneous calls do you have to be prepared to handle? Erlang’s answer turned into an entire branch of applied probability called queueing theory, and the workhorse model — the M/G/∞ queue — is exactly what you want for Bitcoin. M for Markovian (Poisson) arrivals. G for general holding-time distributions. ∞ because there’s no capacity limit; you can always have more pressure show up.
The mapping is direct. Replace “phone calls” with “latent directional pressure on the order book.” A long arrives — someone is leaning to buy — holds for some random time, then exits. A short does the same on the other side. The price moves with the imbalance. That’s it. No discount rate, no terminal value, no narrative about institutional adoption. Just arrivals, holding times, and exits.
(One clarification before any quant readers throw their coffee at the screen: these are not literal queues of customers, and they are not the visible limit-order-book queues. They are latent pressure states — the venue’s hidden buy-side and sell-side lean — inferred from trade prints under the standard M/G/∞ bookkeeping. The paper is explicit about that.)
(I’m aware this sounds suspicious. It sounded suspicious to me too, which is why the rest of the paper is 41 pages of seeing whether it actually works.)
The new paper, just out in the Journal of Risk and Financial Management, does exactly this for Binance spot BTC/USDT from 2020 through 2025 — five and a half years of the world’s deepest crypto venue, spanning the 2021 bull run, the FTX collapse, the ETF launch, and everything in between. The paper treats the latent buy and sell pressure as two independent M/G/∞ queues and asks what observable diagnostics fall out.
Three things do.
Variance per traded BTC. Call it R. It tells you how much price variance the venue is delivering per unit of trading activity. When R rises, you’re getting more volatility per BTC traded — meaning liquidity is thinning. It’s a microstructure tape-reader, in one number.
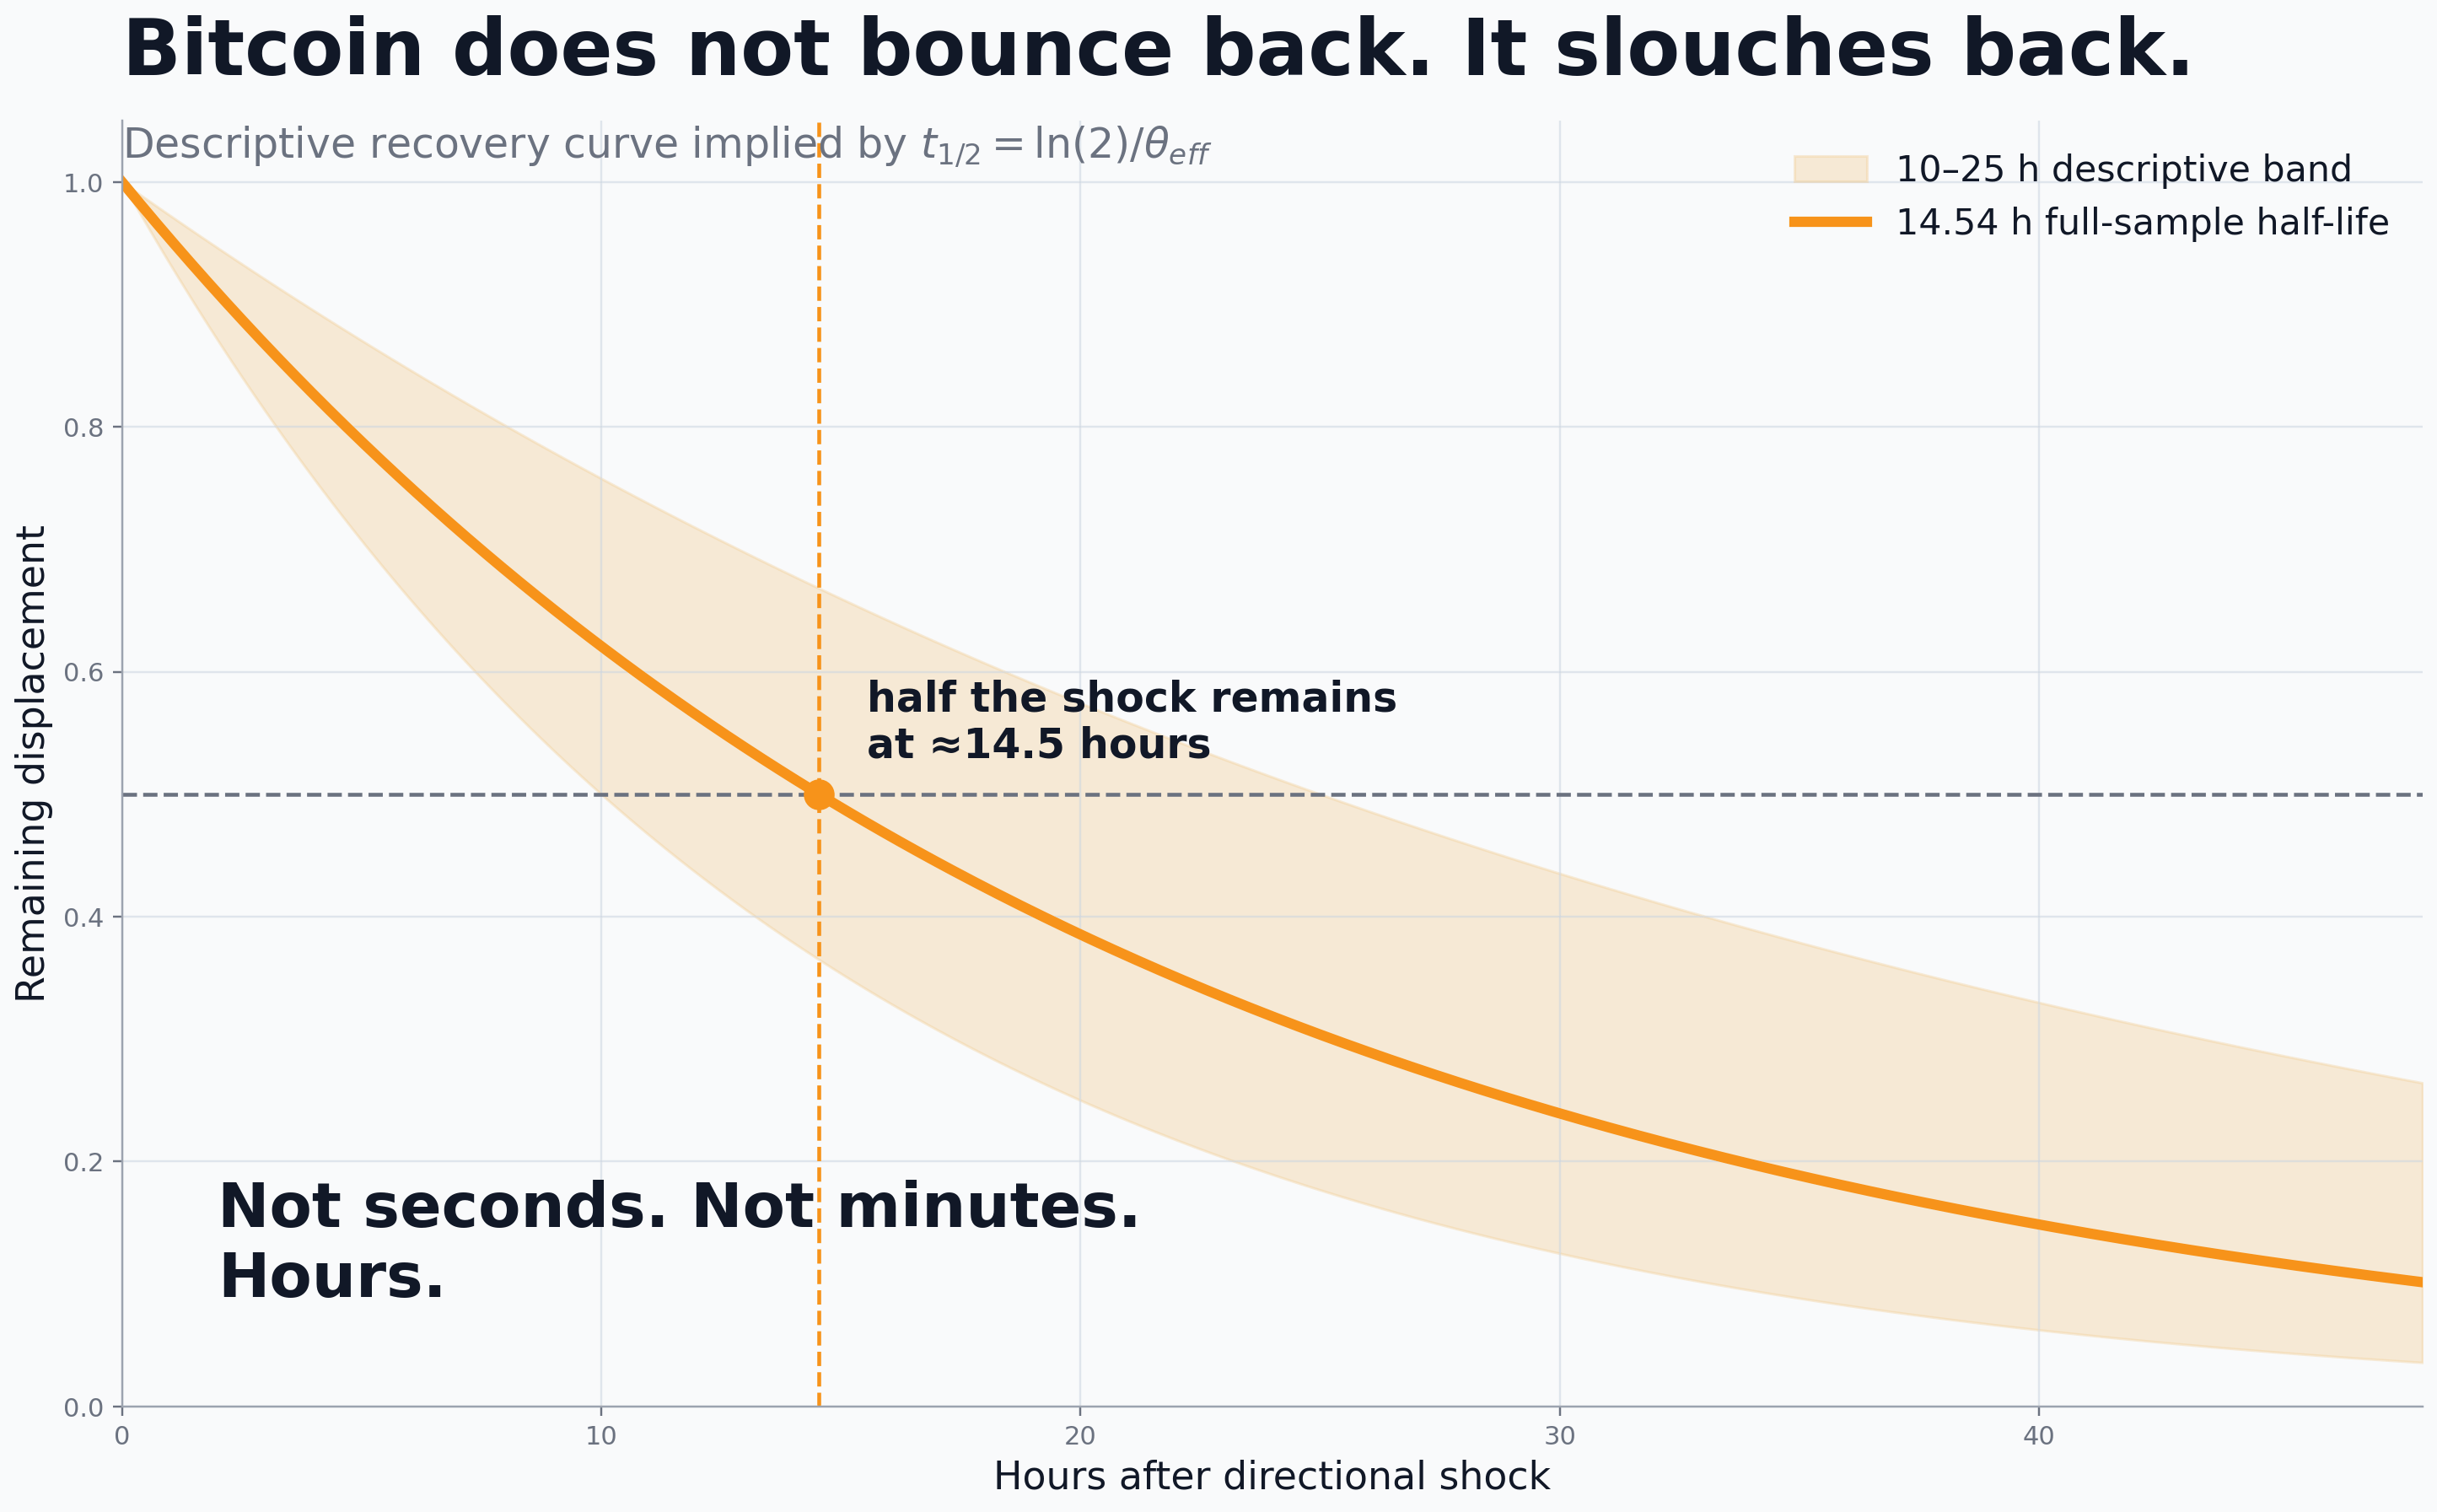
Effective mean-reversion rate. Call it θ. It tells you how fast directional pressure unwinds. Translate it into a half-life and you have a concrete answer to the question: after a shock, how long does it take for half the price displacement to bleed off?
A signed-flow proxy. Are buyers chasing recent up-moves? Are sellers leaning into down-moves? Is the flow contrarian or momentum-following? One coefficient gives you the sign and rough magnitude.
These three diagnostics share one bookkeeping system — they live on the same stock-flow accounting — which is the whole point of organizing the problem as a queue. Reduced-form market microstructure measures (Amihud illiquidity, Kyle-style impact) are essentially separate alarms wired to different bells. The queueing organization gives you a dashboard.
Now to the numbers.
Bitcoin’s resiliency half-life is roughly 10 to 25 hours.
Read that twice. Not seconds. Not minutes. Hours — and not few hours. On the deepest crypto venue on the planet, the half-life of price recovery from a directional shock is comparable to the time it takes to fly from New York to Tokyo.
For a venue whose marketing pitch is essentially “instant global liquidity, 24/7,” this is striking. Bitcoin doesn’t bounce back so much as slouch back. (The same diagnostic on a major equity index would be measured in minutes at most. The recovery profile here looks more like a thinly traded small-cap than a benchmark asset.)
Worse: when I run the same diagnostic on rolling 30-day windows across the five-and-a-half-year sample, only about 39% of windows are clearly mean-reverting under a modest statistical buffer. Roughly half are statistically ambiguous, and the remaining 12% have a point estimate that’s outright non-positive — meaning the diagnostic cannot even rule out a momentum regime. The venue moves between regimes; resiliency is not a venue constant.
This is exactly the picture you would expect from an asset that has no fundamentals to anchor it. Equity prices that get dislocated have an earnings stream to drag them back. Bitcoin’s price has order flow to drag it back, and order flow can decide to do anything it wants.
What about the obvious objection: “you’ve just renamed familiar liquidity measures.”
I expected this objection, so I spent a section addressing it. The standard trade-based liquidity benchmarks are Amihud illiquidity (price impact per dollar of volume) and a Kyle-style minute impact slope. I ran all three on the same 30-day rolling design over the same days and asked which one best sorts next-day tail risk — the probability that tomorrow’s largest hourly move lands in the top decile of the sample.
The queueing diagnostic separates next-day tail days at a high-minus-low spread of 8.6 percentage points. Amihud gets 4.7. The Kyle-style benchmark gets 1.1. The queueing-organized R is positively correlated with both — it isn’t unrelated to them — but it is clearly not the same number, and it sorts forward-looking tail risk roughly twice as sharply as Amihud and nearly eight times as sharply as Kyle.
I think this is because R is anchored in a coherent stock-flow accounting rather than a reduced-form ratio. The same M/G/∞ scaffolding that produces R also produces the resiliency and signed-flow diagnostics, and they all read off the same latent occupancy state. That’s the queueing tax. The dividend is that the diagnostics talk to each other.
(A small parametric overlay handles the heavy tails, because of course the symmetric core cannot fit Bitcoin’s 47-times-Gaussian excess kurtosis. The overlay improves the 99% Value-at-Risk breach rate from 1.80% under a rolling Gaussian to 1.13%. It still does not quite hit the 1% target — Bitcoin’s tails are a separate war — but it is a useful reduction.)
What this implies for normal markets
The cash-flow anchor in an equity is doing real work, and the half-life I measured in Bitcoin gives us a way to quantify how much. For a major equity index, the half-life of price recovery from a directional shock is measured in minutes — because every minute the price stays dislocated, there is an arbitrageable cash-flow value being violated. For Bitcoin, the only thing dragging the price back is more order flow, which is slow. That is why the half-life is 10-to-25 hours instead of single-digit minutes.
Read this as a quantitative measurement of how strongly fundamentals are anchoring a price. The half-life is the answer.
There is an obvious follow-on. In periods when fundamentals are not well-defined for an equity — earnings blackouts, news vacuums, crisis episodes when cash-flow estimates lose their informational value — the equity should start to look more like Bitcoin in its recovery profile. The framework predicts that. I do not have the cross-asset tick data sitting on my desk to run the experiment, but it is the obvious next paper. Anyone with the data, please go.
If you trade Bitcoin
Three things worth thinking about, with the usual caveat that these are diagnostics, not strategies. Use them to size; do not use them to enter.
First, rolling R is a warning system. When the variance-per-BTC moment is in its top third, your next-day probability of a top-decile hourly move is roughly 2.3 times what it is in the bottom third (15.1% versus 6.5% in the sample). When R is elevated, size down. If you market-make, widen.
Second, mean-reversion strategies are a regime trade, not a venue trade. Only ~39% of rolling windows are clearly mean-reverting; another ~12% are clearly not. A flat reversion strategy across all regimes is going to feed your edge to the periods when the model is wrong about the venue. The signed-flow proxy is the regime indicator: when it is high and θ is weak, you are in a momentum window. Do not fade it.
Third — the execution one — the 10-to-25-hour half-life tells you that if you move the price with a large directional order, do not expect the venue to “absorb” it in minutes. You are paying real impact for hours. Plan child orders, hedges, and stop placement accordingly. The 24/7 marketing slogan is true about the clock; it is not true about the absorption.
So: Matt’s model is also a research design. Bitcoin has no cash flows; therefore you cannot model it by discounting cash flows; therefore the entire price-discovery process has to live somewhere else; and the somewhere else turns out to be a queueing system that a Danish telephone engineer wrote down 117 years ago for a piece of analog infrastructure that no longer exists in the form he was studying.
I sent Matt a thank-you note when the paper came out. Intellectual debt to Money Stuff. A confession, while we are here. I personally find the entire edifice hilarious. Bitcoin has no cash flows, no terminal value, no rent — nothing but coordinated belief that the next person will also coordinate. I cannot quite believe this rubbish has value. But I am a libertarian: if people want to trade something with no fundamentals, they should be allowed to. That is what markets are for. I will not stop you. I will, however, do the math on your order flow, because the order flow is real even when the asset is absurd. The math doesn’t care whether you find the substrate ridiculous. It cares about the flow.
This is, I think, the patron-saint problem for finance writing done well. Matt’s job is to make sense of all of finance in several thousand words a day, every weekday, for years. He cannot stop and write the technical paper every time he notices the math underneath. He doesn’t have to. The observation does the work of identifying where the technical paper should be. Then it’s somebody else’s job to actually go write it. I am always going to try to be that somebody else, where I can. The physics PhD was supposed to be the boring substrate I left behind for three decades of trading. It turns out the substrate had things to say.
The paper is open access, free to read, and the Python that reproduces every number in it is on Zenodo. If you want to fight about it — and the Venn diagram of “people who hold strong priors on Bitcoin” and “people who hold them loosely” is a famously empty intersection — please at least bring the math.
Paper: https://doi.org/10.3390/jrfm19050372
If you found this essay worth your time, you may enjoy my book The Science of Free Will, which asks an equally uncomfortable question about an equally cherished story.
If you want to know more about India, start with The Paradox of India, the first essay — or browse the whole series.
Related country-specific work: Albion — Britain’s institutional decline, by someone who first saw the place in 1979.
A footnote on the timing of this post. The Preprints.org editorial team is celebrating their 10th anniversary with a #MyMostMemorablePreprint campaign, and Ellie Gao there nudged me to share the story behind a preprint. This is that story. The fact that the most memorable preprint (and now published paper) I have written started with a Matt Levine observation about Bitcoin having no cash flows is, I think, exactly the kind of origin story they were hoping to hear. #MyMostMemorablePreprint #PreprintsOrg10
Nice article!
You don't understand why Bitcoin have value?
There are many reasons.
It's something verifiably scarce that can be sent over the internet without middlemen.
Without high fees like those of Western Union.
It gives people a new power they didn't previously had.
That ability increase the probability that some people will survive or thrive. Anything that can increase the probability that a person survive has value for that person. The ability to always be able to accept money from anyone. Or always send money to anyone increase the probability that someone will survive.
Life wants to survive and therefore value that which could help it survive. Owning money that can always be sent to anyone in the world does that.
If all you do is trade the price of Bitcoin like some stock you won't understand what it is.