
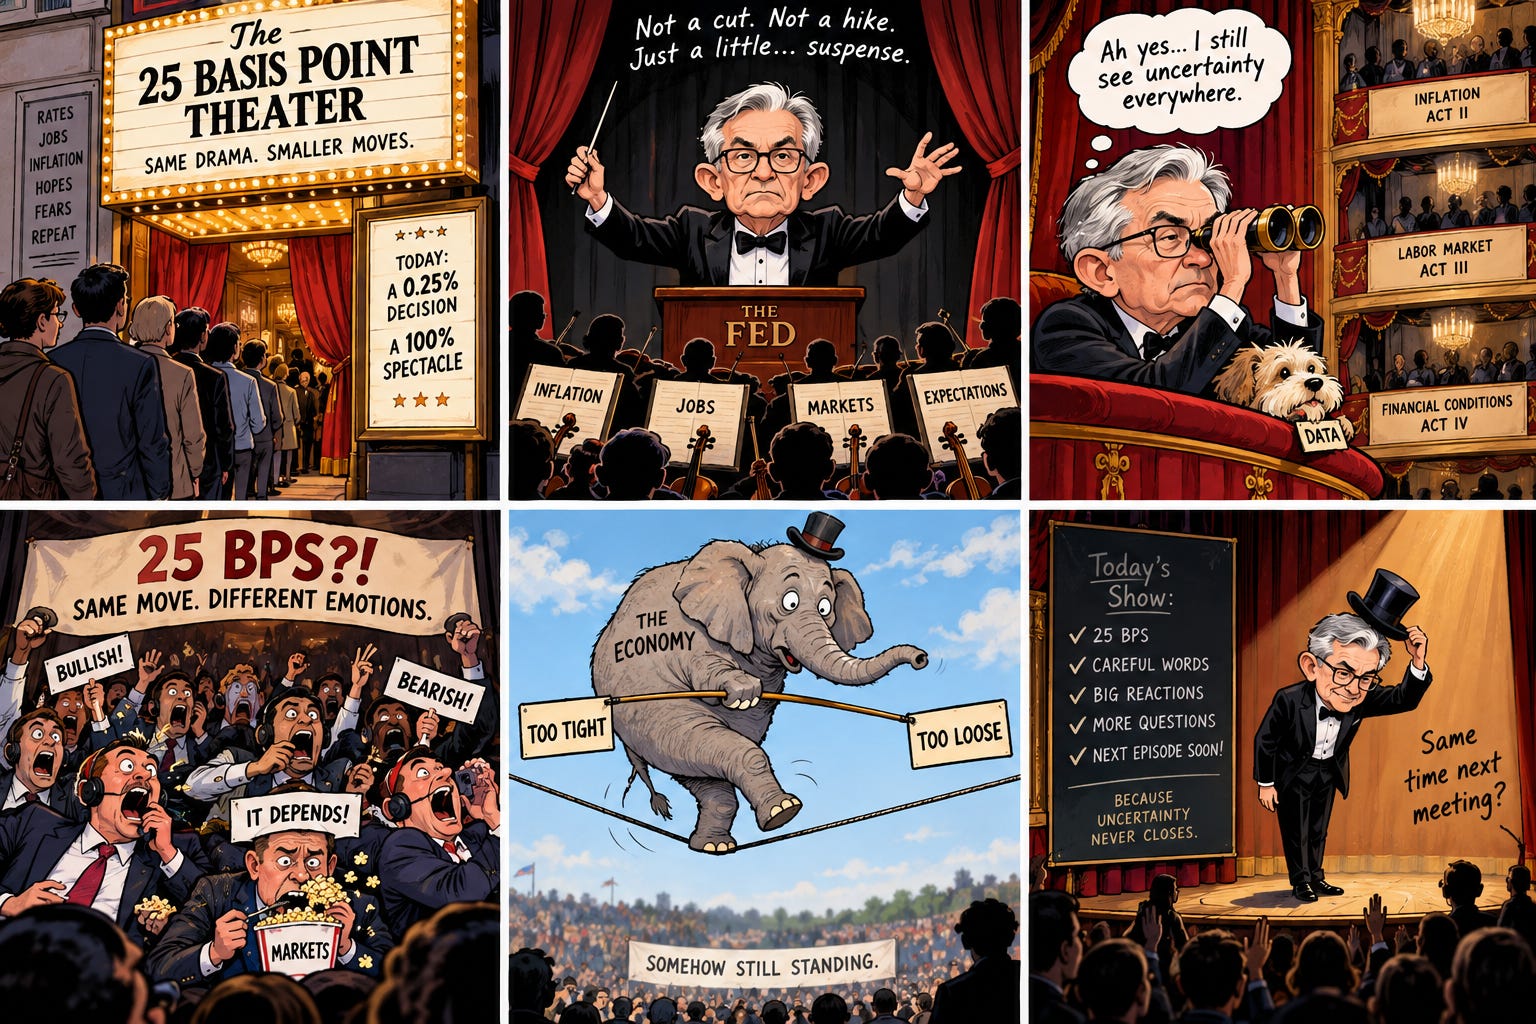
The Financial Times published my letter on this paper, “How the Fed can exploit its scarce credibility,” on September 14.
February 23, 2021. Jerome Powell is sitting in front of the Senate Banking Committee, delivering the semiannual monetary policy report, which is the closest thing American economics has to a state occasion. A senator asks him about the money supply. At that moment, M2 (the broad measure of money: currency, checking, savings, small time deposits) is growing at better than 25% a year on the latest release, and the February figure, published a month later, will print 27.1% as first released, 26.8% in today’s revised series. That is the fastest twelve-month growth in the sixty-year history of the official series. It is not close. The Chairman of the Federal Reserve looks at the fastest money growth any living Fed official has ever seen and says that M2 “does not really have important implications for the economic outlook.”
Sixteen months later, CPI inflation peaked at 9.1%, the fastest in four decades.
One episode proves nothing. What turned it from an anecdote into a paper is that you can build a mechanical alarm on money growth from public data. Nothing fancy: take the twelve-month growth rate, compare it to its own trailing forty-year history, and flag anything wildly outside that experience. If you do this, the alarm trips exactly twice in forty-five years: the 2020–21 explosion on the way up, and the 2023 contraction (the first in the history of the series) on the way down. And because of the government’s own publication calendar, the 2020 alarm was on the printed record (in the Fed’s own H.6 release, its weekly money-stock report, at 4:30 p.m. Eastern on June 11, 2020) a full 257 days before Powell’s testimony, and 643 days before the Fed finally raised rates. The printed values are the ones on the page that day; the band they breached is computed from today’s vintage of the forty-year history, and the paper says so.
The committee was not short of attention in those 257 days. It met, it deliberated, it published projections, it parsed its own adverbs. Its attention was pointed at the wrong scale: at 25-basis-point distinctions it cannot resolve (a basis point is a hundredth of a percentage point), instead of at the one tail event of the past half century, which was ringing on its own data release.
That inversion is the subject. My paper on it, “Dead-band monetary policy: a practitioner’s case against point-targeting,” came out recently in Business Economics, the journal of the National Association for Business Economics. The full text is free through this link, and the ungated preprint is on SSRN. What follows is the argument in English.
What a rate move can actually do
Start with the instrument. The Fed is superb at implementation: it can pin the federal funds rate, the overnight interest rate it steers, inside its target range to within basis points, day after day. That part is a solved problem. The question is what the level choice buys: when the committee agonizes over 4.25% versus 4.50% because inflation printed 2.7% instead of 2.3%, how much inflation control is the committee actually exercising?
You can put numbers on this, and the numbers are the heart of the paper. Take a decisive move: 50 basis points, held for a full year. Map it into economic activity using the two most credible methods the literature has for isolating what a rate move does (they measure one-off shocks, so the year-long move is scaled up from them, and they disagree, so carry both). Map activity into slack, the gap between what the economy is producing and what it could, and slack into inflation using the best modern estimate of the Phillips curve slope, the rate at which slack converts into inflation. That estimate comes from comparing U.S. states, and it is small: a one-point change in slack moves annual inflation by well under a tenth of a point on impact. Run the whole chain and the 50-basis-point move shifts annual inflation by somewhere between 0.09 and 0.49 percentage points, depending on which method you trust.
Now ask what the committee can see. Real-time estimates of economic slack get revised, on average, by more than a full percentage point (this is Athanasios Orphanides’s famous result, and it is most of the explanation for the 1970s). Pass that measurement error through the same arithmetic, add the revisions the inflation data themselves receive after first release, and the blur on the gauge is 0.27 to 0.37 points of inflation. And that is before you notice that the two inflation yardsticks the Fed watches, CPI and PCE (the consumer price index and the personal consumption expenditures index), have differed since 2000 by 0.36 points on average, which means “2.3% inflation” is not even a well-posed number until you say which ruler you used.
Put the two together. The signal from a decisive rate move is roughly the size of the noise on the instruments that would confirm it worked. Under one method the move clears the floor; under the other it is a third of it. Either way, a committee meeting eight times a year to resolve 2.3 versus 2.7 is doing something strange: it is deliberating, at enormous length and with the world’s markets watching, over differences its own tools cannot deliver and its own gauges cannot verify.
The claim has a scale attached. The Phillips curve is alive; its slope is just small, and it was small before 1990 too. Monetary regimes matter enormously; Volcker happened. At the scale the committee actually debates, inside half a point of target, the control content is inside the noise of the committee’s own gauges, which is why the meetings are really about the words.
The controller in your hallway
Control theory solved this problem before the FOMC existed, and the solution is in your hallway.
Your thermostat has a dead band. Set it to 70 and it does not fire the furnace at 69.7 and the air conditioner at 70.3; it waits, deliberately, inside a band of a degree or two, and acts only at the edges. It is built that way for exactly two reasons: the gauge is only so accurate, and switching the equipment on costs something. Under those two conditions (noisy measurement, costly action), the optimal controller holds still inside a band and acts decisively at the edges. This is standard engineering, it has been standard since before the transistor, and the paper derives the band width from first principles in about a page.
Economists know half of this result. William Brainard showed in 1967 that uncertainty about your instrument’s strength should make you steer more gently (the celebrated “Brainard attenuation”). But attenuation alone never tells you to stop; a timid hand is still a hand on the tap. What converts “steer gently” into “hold still, then act decisively” is a fixed cost per action. And an FOMC rate change is close to a pure fixed-cost action: it is a discrete, broadcast, credibility-spending event. It moves the entire yield curve through expectations, and the market prices it per action, not per basis point. Add that cost to Brainard’s problem and the dead band drops out of the algebra, with a computable width that grows with instrument uncertainty, with measurement noise, and with the action cost. The first two are measured above. The third the paper assumes and does not measure; the algebra says what follows if it is material.
So the committee’s own situation (weak instrument at fine scales, noisy gauges, expensive actions) is precisely the textbook case for a dead-band controller. The institution instead runs the opposite design: maximum attention at minimum resolution.
The alarm that was on the record
Meanwhile, in the tails, the story runs the other way.
The Fed abandoned monetary aggregates for three good reasons. Targeting money invited Goodhart’s law (a measure that becomes a target ceases to measure), and the 1979–82 experiment ended badly. Velocity proved unstable at exactly the frequencies a target needs. And the workhorse models legitimately carry no separate role for money once the interest rate is the instrument. All three points are correct. All three are points about money as a target.
None of them touches money as a tail indicator. A target has to be informative continuously, at every frequency, while being shot at. An indicator has to be informative only at the extremes, and nobody targets it, so Goodhart has nothing to grip. And the data have exactly that shape: across 141 countries over thirty years, money growth and inflation line up almost perfectly where inflation is high, and the relation goes slack and noisy below 10%, slacker still below 5%. Quantity theory is a great theory of 20% inflation and a weak theory of 2.3% versus 2.7%. That weakness is the design principle: the aggregate is silent exactly where the dead band sits, and loud exactly where the triggers belong.
And 2020 was as close to a clean experiment as monetary data get. The money growth of 2020–21 was not banks endogenously creating credit (the standard, and fair, objection to reading causation into money-inflation correlations). It was, in the main, transfer payments deposited straight into checking accounts: helicopter money in the textbook sense, created by fiscal decision and accommodated by the Fed. A policy-engineered injection of a quarter of the money stock in one year is an experiment, and the arithmetic that is weak science at 30 basis points of deviation is strong science at 25 percentage points of impulse.
One engineering detail from the paper, because it is my favorite part. The naive alarm (trailing mean, three standard deviations) has a self-defeating flaw: the 2020 explosion enters its own trailing window and inflates the estimated standard deviation so much that the historic 2023 contraction (minus 4.6%, the deepest in the series’ history) never trips it. The last fire’s smoke blinds the smoke detector. The fix is to use robust statistics (median and median absolute deviation), which the explosion barely moves. The robust alarm catches both episodes and, in forty-five years of data, nothing else. If you calibrate it using only data through 2018 and freeze it, it still catches both. This is what an instrument panel is supposed to look like: dark for decades, unmistakable when it matters.
The rule
So the paper proposes a rule, stated as a rule, with every trigger threshold computed from public data and the band edges chosen and defended. Three clauses.
First, the dead band: the committee takes no funds-rate action while twelve-month core PCE inflation (the personal consumption index with food and energy stripped out) sits inside 1.5% to 3.0% and no trigger has tripped, with the parked rate reset whenever the committee revises its own estimate of the longer-run rate. This is the inflation leg of policy; the paper sketches a matching employment leg with a Sahm-type trigger, and sends financial stress to the Fed’s facilities and balance sheet, with a genuine emergency declared as an edge event. Second, the triggers, pre-announced: the robust money-growth alarm just described; a band on five-year, five-year-forward inflation compensation (the market’s own pricing of whether the anchor is moving); and a fiscal-impulse diagnostic, readable only after the fact because recession dates arrive late, that flags stimulus applied to an economy that no longer needs it (it trips exactly once in its history: the three quarters spanning the pandemic transfers). Third, edge behavior: outside the band, or on any trip, the committee’s ordinary published reaction function resumes, and communication concerns trigger status rather than adverb selection.
The band is asymmetric on purpose: the floor sits half a point below target and the ceiling a full point above, because the cost of sliding toward the zero lower bound, the floor below which rate cuts stop working, is asymmetric, and the compensation trigger’s two historical trips (2008–09 and 2020) were both on the low side. The compensation trigger, as calibrated, has historically been an easing alarm. This is not a hawk’s charter.
What is the rule’s historical footprint? Of the 184 target changes since 1980, 73 happened with inflation inside the band and every trigger quiet. Since 1990, it is two out of three. Two-thirds of the committee’s actions in the modern era were spent inside the zone where the signal cannot clear the floor. That number is an upper bound (some of those moves were about employment or financial stress, which the inflation band does not govern), but the converse number is the striking one: the alarms demand attention a handful of times in four decades. The committee sprays its scarce credibility, spent per action and per miss, at the noise floor.
The strongest objection is a real one: maybe the anchor holds because the committee visibly sweats the small stuff. Maybe announced indifference inside the band lets expectations drift to the ceiling and squat there, quietly converting a 2% regime into a 3% one. This is the serious version of the objection, and three decades of actual band regimes (Canada at 1–3% since the early nineties, Australia at 2–3% since 1993, New Zealand since 1990) answer only part of it, because all three steer toward their midpoints; none practices true in-band indifference. Two things blunt it. The rule is conditional indifference, bounded by pre-committed triggers inside the band and the ordinary reaction function at the edges, and rules with announced boundaries have historically out-anchored discretion with unannounced ones. And the vigilance claim itself has now been priced: the full apparatus of point-vigilance (live meetings, dot plots, testimony, the parsing industry at battle stations) was operating at maximum attentiveness in February 2021, and it registered nothing, because the framework’s model contained no channel for the one thing happening. Whatever the sweating buys, it did not buy vigilance.
What dies: the dots
The practitioner’s observation underneath all of this, from someone who has priced Fed communication in markets for three decades: at this scale, the words are the policy. There is an entire industry, employing some of the finest minds of my generation, dedicated to divining whether “some time” means June. The dot plot, the chart of where each official thinks rates are going, is studied like the Zapruder film. Announcement days still run measurably more volatile than the day before (p = 0.016, for those keeping score), and the five days after an announcement run about 20% hotter than the five before. The 25 basis points buy little inflation control anyone can measure inside a half point of target; the sentences move everything. Markets brace for the sentences because the sentences are where the information is.
Under the rule, an in-band meeting with quiet triggers and no reset due carries no rate news by construction. The dots die, or at least the meeting-by-meeting reading of them does. The adverb-parsing industry is quietly reallocated to productive activity, possibly involving actual forecasting of actual tails, which is what the monitoring kit in the paper’s appendix hands them: four public data series and a decision tree. A regime change that succeeds leaves a measurable microstructure signature (the announcement premium compresses toward an ordinary Tuesday), and the paper names its signature in advance, so the proposal is falsifiable in the one currency I trust, which is prices.
Chair Warsh announced a communications review in the summer of 2026 and has been de-emphasizing calendar guidance in favor of conditional commitment language. That is the rule’s communication posture without its written conditions. A conditional commitment with unpublished conditions is a mood. The rule completes the move: publish the band, publish the triggers, and let an in-band meeting be what it already is, which is a non-event, now honestly labeled.
The Fed’s credibility is spent per action and per miss, and the current regime economizes on neither: it acts constantly at a scale it cannot resolve, and it missed the one tail in forty-five years that its own deleted gauge was screaming about. A central bank that holds still where its tools cannot resolve the difference, and moves hard when its own announced alarms ring, spends that scarce currency where it buys the most. What markets would pay for is what committees are constituted to provide and currently do not: predictability in the tails, purchased with silence in the middle.
The paper: “Dead-band monetary policy: a practitioner’s case against point-targeting,” Business Economics (2026). Full text free at rdcu.be/KJCc1Rkt5b6a; ungated preprint at ssrn.com/abstract=7233381. Every trigger threshold, trip date, and figure is computed from public data (FRED, Brookings, the Fed’s own releases), and I verified the derivation symbolically; the appendices tell you exactly how to check my work. Please do.
My book, The Science of Free Will, asks an equally uncomfortable question about an equally cherished story.
New here? The India series starts with The Paradox of India (full series here). And if institutional decline is your genre, there’s Albion: Britain’s decline, first seen in 1979.
The detail here is terrific. What I found most persuasive is that you don’t just argue that the Fed is fine tuning inside the noise. You quantify the likely impact of the tool, quantify the measurement error, and then compare the two.
The thermostat analogy makes the implication wonderfully simple: when your ability to measure and control something is this imprecise, stop pretending that greater precision in the decision produces greater precision in the outcome. Focus attention where the signal is actually strong.
Loved reading this! Adding your research paper to my references list since I am working on control theoretic policies to make central banking more adaptive for my PhD final year. I am leaning towards a more decentralized free banking-type solution for getting rid of the mismatch between the timescales at which prices change (days) and the timescale at which fed rates change (months). Th fed's main job then would be to measure inflation and concentration risk of differing monies. These might be much more doable on a quarterly/monthly timescale.